
Case Study #4: FrankenTheory

Boundaries in My Analysis of Google Analytics
I am limiting my analysis of Google Analytics as an object of study by focusing on its activities and its data model as reported in terms of dimensions and metrics.
- Google defines Analytics activity as collection, collation, processing, and reporting.
- Google describes its data model as consisting of user, session, and interaction.
- Google collects and reports data in terms of dimensions (“descriptive attribute or characteristic of an object”) and metrics (“Individual elements of a dimension that can be measured as a sum or ratio”) (Google, 2014).
These limits and terms are described in detail in my earlier Re/Proposed Object of Study: Google Analytics blog post.
I chose GA as my object of study because it’s a tool with which I work on a daily basis. I proposed GA as my object of study to my boss, the director of our school’s marketing and communications team, before formally proposing it in class because I wanted approval to use our school’s GA account in my study. I also expected my study to contribute to my understanding and use of GA in web development and management. A deeper understanding of GA as a network has provided both a tool for theoretical exploration and practical application.
Here’s an example of how applied this theoretical study has become. On April 16, with little fanfare, Google announced that it was replacing the term “visit” with the term “session” in its reports. I missed the announcement entirely, so I was surprised while measuring the result of online advertising efforts in our campus newspapers to discover that the “unique visits” metric that I had been using was no longer available; instead, it had been replaced by the “sessions” metric, without the “unique” modifier. I was also surprised to discover that the “unique visits” metric I had been using did not match the “sessions” metric when I re-ran prior reports to test data accuracy reports; “sessions” reported higher numbers than “unique visits” had reported. As we reached the first of May, when I normally complete April reports, I realized the full extent of the terminology change: “unique visits” were no longer being measured. Two plus years of reporting data were potentially compromised as inaccurate, since we report data for month on month and year on year comparisons (e.g. does April 2014 look better than April 2013 in terms of overall unique web visits, and does the calendar year-to-date period of January-April 2014 look better than the previous January-April 2013 period?).
As a result of my study of the structure and function of Google Analytics, I had learned how GA counts session data. Critical inquiries had questioned whether GA’s reporting of unique visits could be accurate given the browsing patterns of today’s web visitors. Visits (now sessions) are defined as individual browsing sessions on a given website on a given browser and platform. A visitor (now user) who visits the same website using two different browsers (Chrome and Firefox, for instance) would be calculated as two unique visits (when unique visits were provided) because the session is browser specific. Furthermore, a visitor who visits the same website on a desktop platform browser, then revisits the same website on a mobile device, would be calculated as two unique visits, because the session is platform specific. In short, “unique visit” is really a calculation of “individual session” without a distinction of uniqueness of the visitor. Using the term “unique visit” suggested (and my marketing team and I took it to mean) visits by unique users, a measurement we considered superior because it suggested the actual number of visitors. What we should have been measuring, however, was visits, regardless of their “uniqueness,” because there was no unique quality to the visit in terms of the visitor. The end result is that I will need to re-record our historical data in terms of sessions rather than unique visits, potentially revealing visit patterns we had not before seen or understood.
Without this study of GA as a network, I would not have understood why reporting data did not match, and I would have struggled to find documentation of the issue. There remains little documentation from Google itself about the disappearance of unique visit as a reported metric as of this date. In short, the application of my theoretical exploration directly benefited my and my team, and ultimately our school and our understanding of our data within the framework of industry benchmarks.
Theories of Networks and Google Analytics
I’m using two theories — Castells’ network society and Deleuze & Guattari’s rhizome — to flesh out my understanding of Google Analytics and sketch out my Frankentheory of a network.
First, here’s a review of some familiar territory: My application of Castells’ network society to GA from Case Study #2. I’ve brought this in as a piece rather than linking to it because I’d like to make departures from specific aspects of this application in discussing Deleuze & Guattari and in sketching out a Frankentheory.
Defining Google Analytics
Castells (2010) considers technology to be society (p. 5). As a result, GA can be considered social. As an information technology, GA creates active connections between websites (data collection), Google data centers (data configuring and processing) including aggregated tables (processing), and GA administrator accounts (configuring and reporting). These active connections collect, mediate (configure and process), and report on the three aspects of the GA data model consisting of users, sessions, and interactions. These connections represent social actions. So Castells (2010) might define GA as a global informational network (p. 77) that collects data from and reports data to local nodes (websites). Google servers where data are configured and processed might be considered mega-nodes (xxxviii) that, through the iterative process of increasing user visits and interaction by improving website design and content based on GA reported results, impose global logic on the local (xxxix).
Nodes in Google Analytics
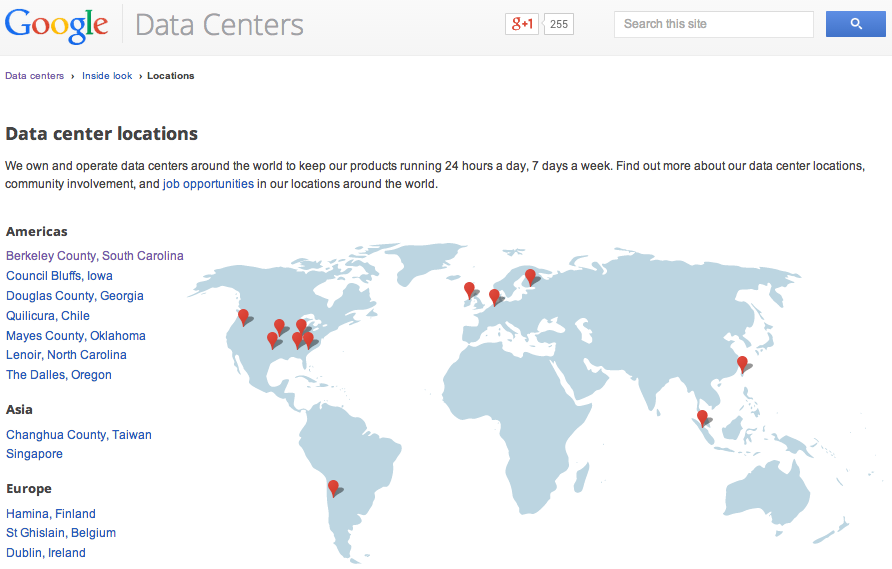
Google Data Center Locations: Image from Google Data Centers.
Individual websites, GA account administrators, and website visitors are local nodes in the global informational network. Google data center servers are mega-nodes in the network. Google employees who program GA and maintain Google servers and centers are localized nodes in the global network. Google’s data centers are located in a variety of locations that include North America, South America, Europe, and Asia. Several are found in Castells’ (2010) “milieux of innovation” (p. 419) including Taiwan, Singapore, and Chile. Others are found in what appear to be unlikely global spaces, including Council Bluffs, Iowa, and Mayes County, Oklahoma. These locations reiterate Castells’ insistence that local and global are not mutually exclusive polar opposites; rather, the new industrial system is neither global or local, but a new way of constructing local and global dynamics (p. 423). Websites, administrators, visitors, servers, and employees are simultaneously localized nodes (even the the mega-nodes are situated in space and time) in the global informational network.
Agency among Google Analytics Nodes
GA account administrators and website visitors have the greatest level of agency in the network, while Google employees exert limited agency within the confines of their labor relationships and conditions. Account administrators would likely be considered among Castells’ (2010) “managerial elites” (p. 445), while Google employees who maintain and program the servers might be part of Castells’ disposable labor force (p. 295). Account administrators have the authority to configure GA data, including the ability to filter out results, narrow data collection according to metrics and dimensions, and even integrate external digital metrics in GA. This authority is not, of course, the authority of Google’s corporate structure and hierarchy, but within the boundaries of GA data model and activities, account administrators exude authority. Website visitors may choose to visit, or not visit, any given website, once or more than once (meaning a single session or multiple sessions). This agency includes the power to intentionally separate themselves from the network, meaning that, for users, they only enter into the network as a node when they visit the tracked website. Interestingly, only the GA administrator has authority to eliminate users from the network; account configurations may filter out visitors along several dimensions.
Nodal Situation and Relation
Nodes are locally situated. While simultaneously part of the global informational economy, all of the nodes in the GA network are situated in a space and time. This simultaneous here/there compression of space and time is the origin of Castells’ (2010) “space of flows” (p. 408) and “timeless time” (p. 460). Websites are simultaneously hosted on physical servers around the world and locally viewed on specific platforms and media. Users are simultaneously accessing global data in territorial space on hardware. GA administrators are situated while configuring accounts and loading reports from the cloud. Google data centers are situated in specific locations, but they collect and process global data from local spaces and times. Google employees are culturally and territorially situated in the global Google labor pool.
Data rarely travels along parallel paths in the GA data model or GA activities. Website visit data are collected in the data model — user, session, and interaction data — and sent to Google data centers for processing and configuration. Other than writing unique user identification data onto cookies on users’ browsers or apps, little data travels from GA to users. Website content is indirectly affected by GA reports configured and read by GA administrators, but within the GA activity network, websites are unaffected by GA activity on the data model. Beyond the boundaries of the OoS, of course, Google serves plenty of data, in the form of ads, back to users. But that’s now beyond the scope of this study.
Movement in the Network

Framework for Movement: Wires in The Dalles, Oregon, Google Data Center. Photo from the Google Data Center Gallery.
Data moves in GA. More specifically, data in the GA data model moves in GA. Data are initiated by users visiting tracked websites. Specific frameworks must be in place for connections to occur and data in the data model to be collected. Namely, websites must contain GA tracking code, embedded in the website code through the agency of the GA administrator. The embedded GA tracking code enables, and the web browser and hardware afford (Norman, n.d.), the user to initiate a tracking pixel (gif) and generate data to be collected in the GA data model. Once collected, the data are configured (by the account administrator and by the GA algorithms), processed (in a largely opaque manner) and collated in aggregated data tables, and reported in visual and tabular representations. In Castells’ (2010) terms, data represent flow in the GA network (p. 442). That data is both spatial and temporal (it comes from and is attached to a specific territory and represents a specific, chronological activity), but it is also entirely global and digital.
Content in the Network
Data are collected and packaged — literally, in a gif image pixel — in parameters relating to user, session, and interaction. The GA tracking code encodes data and sends it to Google data centers where the data are decoded, configured based on administrator preferences, processed and repackaged in aggregated data tables, and made available to the account administrators. The reporting function remediates the data in visual and tabular formats for ease of reading and use. While the data reported are considered authoritative and authentic, the actual processing function remains largely proprietary, with only end results available to extrapolate what processing actually occurs. This black boxed processing function seems unlikely to represent Latour’s (2005) intermediary; as Fomitchev (2010) claims, there are probably processing functions that result in highly mediated, possibly even inaccurate, results. Castells (2010) would likely measure GA performance based on “its connectedness, that is, its structural ability to facilitate noise-free communication between its components” (p. 187). I hope we will see increased academic scrutiny focused on this perceived intermediary function in GA, even as we scholars rely on its results.
Birth and Death of a Network

Killing the Network: Failed Google data hard drives to be destroyed at the St. Ghislain, Belgium, Google Data Center. Photo from the Google Data Center Gallery.
Castells (2010) indicates that global informational networks emerge within milieux of innovation. These main centers of innovation are generally the largest metropolitan areas of the industrial age (p. 66), able to “generate synergy on the basis of knowledge and information, directly related to industrial production and commercial applications” (p. 67), and combine the efforts of the state and entrepreneurs (p. 69). Nodes on the network get ignored (and therefore cease to be part of the network) when they are perceived, by either the network or by its managerial elites, to have little value to the network itself (p. 134). The GA network grows as more nodes are added, either as users or as web pages with tracking code. GA administrators have agency to kill network nodes by removing tracking code from pages, or by directing IT managers to remove poorly performing web pages. Users have agency to quit visiting a website, thereby removing its value to the person. While many other actions by agents outside the GA network may affect the growth or dissolution of the network, they are outside the boundaries of the GA activity and data model.
And Now, the Rhizome
First a note about using Deleuze & Guattari. I did not enjoy or particularly “get” this reading the first time around. I grasped the broad strokes of the argument, but this is a chapter that requires close, multiple readings. What I discovered as I re-read the chapter in light of this analysis was that it addresses a significant aspect of networks that Castells does not — namely, a rhizomatic approach to networks problematizes the very definition of GA I established during my Re/Proposal. In short, applying Castells profited from the boundaries I placed on the OoS; applying Deleuze & Guattari requires eliminating the boundaries, preferring instead a situated, chronological cross-section as a set of boundaries enabling analysis.
Second, a note about this cross-sectional approach. In my scaffolding outline, I referred to a “flattened, rhizomatic” approach to composing and networks. Placing these two concepts together elicited useful feedback and discussion during the following class, as a result of which I realized that rhizomes are not naturally flattened. While Deleuze & Guattari (1980/1987) refer to flattened multiplicities, they do so in the context of many dimensions: “All multiplicities are flat, in the sense that they fill or occupy all of their dimensions” (p. 9). In fact, rhizomes are unpredictably dimensional; connections can and must occur along all dimensions: “any point of a rhizome can be connected to anything other, and must be” (p. 7). Since the boundaries of such a “network” can’t really be established, one way to analyze the rhizome is to take a cross-sectional slice, situated in space and time, of the rhizome and examine the relationships among points in the rhizome in this “flattened” slice. The rhizome is a multidimensional assemblage, not a flattened network.
These two notes represent realizations that complicate and problematize the restrictive perspective I offered of GA as a network. Limiting the network to GA activities and data model resulted in limits to what I could discuss in my application of Castells. For example, in discussing the birth and death of the network, I cut short my analysis with this limiter: “While many other actions by agents outside the GA network may affect the growth or dissolution of the network, they are outside the boundaries of the GA activity and data model.” Similarly, when addressing nodal situation and relations, I wrote this limiting statement: “Beyond the boundaries of the OoS, of course, Google serves plenty of data, in the form of ads, back to users. But that’s now beyond the scope of this study.” These limits were real — the boundaries I established for describing GA as a network did, in fact, prevent addressing aspects of the network — but they do not reflect an accurate mapping of GA network activity. Deleuze & Guattari (1980/1987) point out that “the rhizome is altogether different, a map and not a tracing” (p. 12, emphasis original). Tracing is the role of centralized control, of perspectives limited by binaries and “tree logic”: “What distinguishes the map from the tracing is that it is entirely oriented toward an experimentation in contact with the real” (p. 12). A mapped understanding of GA must address its real complexity, its nodes and connections in terms of real experiences, not centrally-defined boundaries.
A mapped, cross-sectional perspective on GA as a network was, to my surprise, the goal of my first case study. In fact, the first visualization of the network I provided was a portion of a Popplet titled “Visualizing a Partial Google Analytics Data Set.”
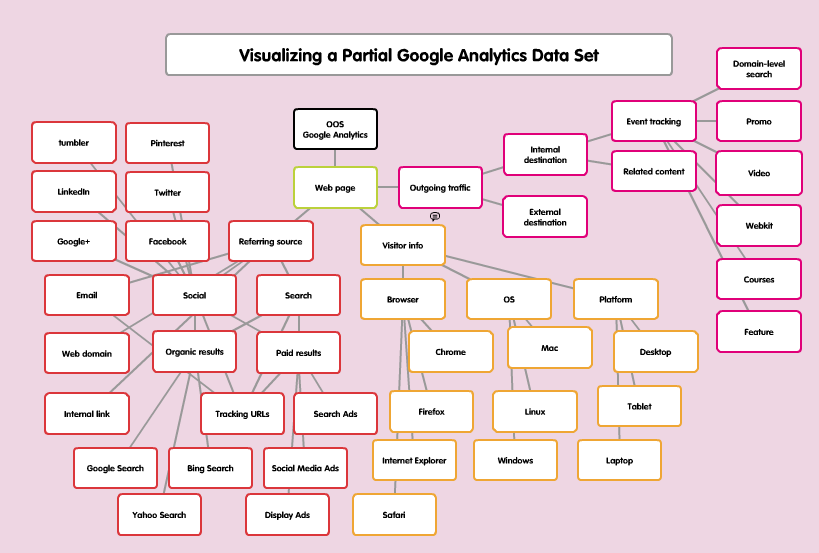
Figure 1: Visualizing a sample Google Analytics data set from Case Study #1—Popplet
My original attempt to visualize and define GA as a network was more chaotically rhizomatic than any other depiction I’ve attempted since. In fact, for much of the rest of the semester, I’ve been struggling to trace my understanding of GA as a network, when in fact Deleuze & Guattari would have me do precisely the opposite: map the multiplicity of GA as assemblage, depicted as a cross-sectional portion of the network situated in time and space.
Mapping GA as rhizome means accepting that users, servers, computers, mobile devices, browsers, operating systems, marketers, developers, programmers, designers, GA account administrators, Google data centers, Google programmers and server maintenance personnel, homes, home offices, office buildings, network cables, routers, switches, weather conditions, satellites, trans-Atlantic communications cables, seawater, signal degradation, electrons, light energy, insulators, and theorists must be included as nodes in the GA rhizome. GA collects data on some of these dimensions; other dimensions, however, are embedded as affordances and constraints to the web technologies that enable GA to measure dimensions at all, so these affordances and constraints must also be depicted in a cross-section of GA as rhizome.
There’s a reason Deleuze & Guattari did not include a visualization of the rhizome on their chapter. It’s too complex, too multi-dimensional, to capture in a 2-dimension drawing. But I’m going to give it a shot.
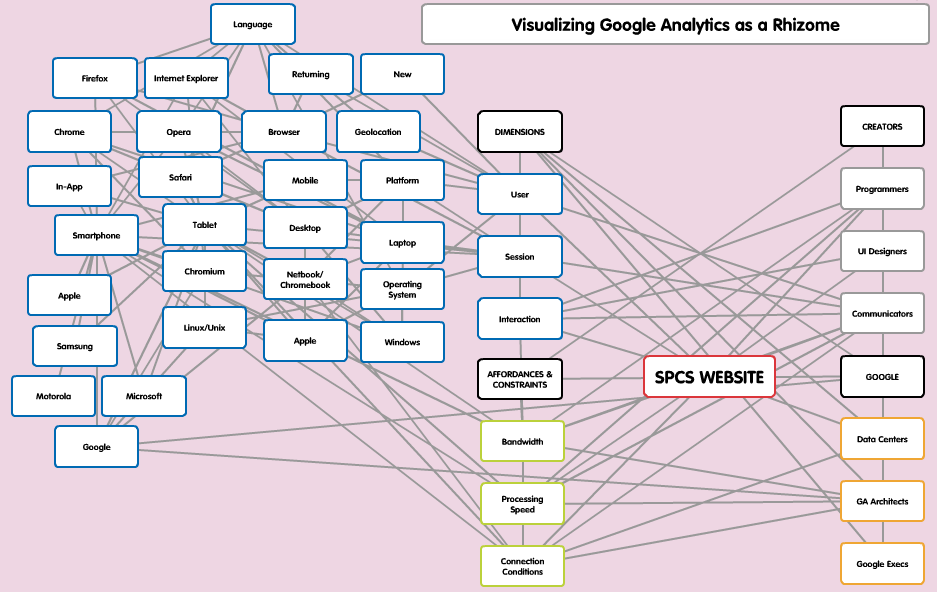
Figure 2: Visualizing Google Analytics as a Rhizome—Popplet
Figure 2 depicts a rhizome cross-section of a single node, User, and the connections that exist among dimensions of the GA data model, website affordances and constraints, website creators, and Google personnel. What this depicts is that a User connects from and to most of the nodes, that the nodes connected to the User are connected to one another, and that relationships proliferate exponentially if extrapolated to the entire list of dimensions. And these dimensions are themselves necessarily limited (perhaps even cross-sectioned) by the visualization technology and my own time and patience. Were I to connect all of the non-technological aspects to the User—like location and weather conditions — the rhizome could go on forever. The point is that mapping the actual rhizome, rather than tracing the limits of the network, generates the rhizome itself. Or, as Deleuze & Guattari (1980/1987) propose, “The map does not reproduce an unconscious closed in upon itself; it constructs the unconscious. It fosters connections between fields, the removal of blockages on bodies without organs, the maximum opening of bodies without organs onto a place of consistency. It is itself a part of the rhizome” (p. 12).
Closing Gaps
Castells offers a remarkably cogent and highly matched means of analyzing GA as a network as defined by Google itself: in terms of GA activities and the GA data model. Castells addresses issues of localization and globalization in ways that make sense for GA defined as Google defines it. Here’s my conclusion from Case Study #2.
While Castells addresses the local, he tends to discuss localization in terms of groups rather than individuals. In this way, Castells more closely resembles ecological theories that apply to organism categories rather than to individual organisms. He regularly refers to groups of people and nodes: the managerial elites (rather than individual leaders), the technological revolution (rather than revolutionary technology pioneers), and the global and local economy (rather than the economic wellbeing of the individual small business owner). The result is that I can’t really address the individual user as a single agent in GA. Then again, this is hardly a hardship, in that GA aggregates data and anonymizes identities. GA, too, resembles an ecological theory rather than a rhetorical theory; it focuses on profiles of territorially localized users rather than individual users in a specific city. As a result, Castells and GA match rather nicely in defining the boundaries of the discussion. In fact, I’d argue that GA (and Google more broadly) represent precisely the network society Castells defined in his text. It’s interesting that he didn’t predict or recognize the rise of Google as I would have expected him to do in his 2010 preface. And Castells’ (2010) discussion of communication media clearly did not predict the popularity or ubiquity of Google’s YouTube on the network as a differentiated medium whose content is driven by user tastes and users-as-producers (p. 399).
Once we admit the possibility that GA is not just what Google says it is, but that GA represents a much wider and broader rhizome of connections, Castells no longer adequately describes the network. GA as rhizome requires additional theoretical application for understanding and visualizing.
Frankentheory
After a semester of theorizing, what’s my own theory of networks?
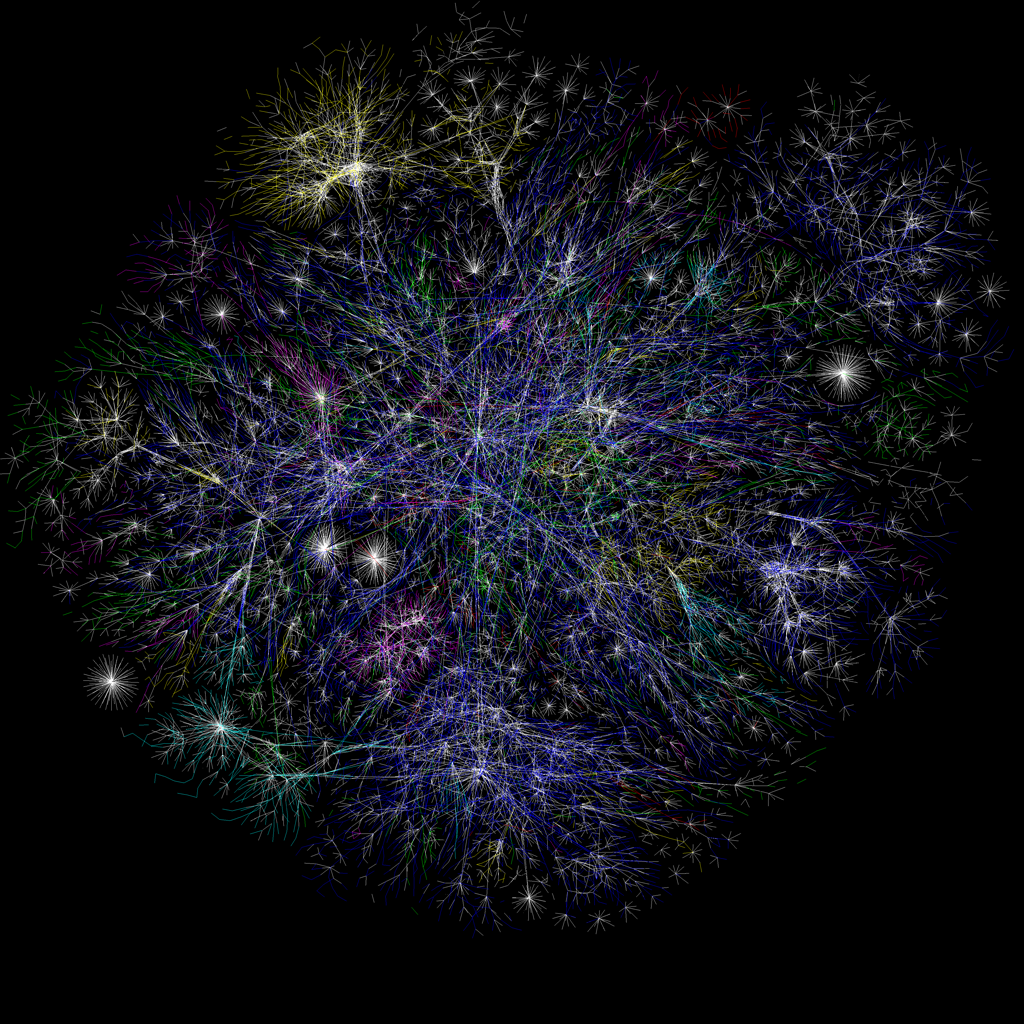
What I think a rhizome looks like. “The Opte Project” by Barrett Lyon. Creative Commons licence CC BY-NC-SA. From The Accidental Technologist‘s post The Way of the Rhizome #h817open
Networks are local. They are also global. This is not dualism, but convergence. Local and global converge in time and space, and we must be prepared to engage in both simultaneously. The global remains rooted in the local; local conditions and environments affect and influence connections to the global. In our efforts to understand global network activity, we should not lose sight of the affordances and constraints of local conditions, including available access to the internet, proximity to other nodes, and the politics of nodal connectivity.
Networks enable nodes. A collection of nodes does not a network make. Networks enable nodal activity; this means that network frameworks must be in place for networks to exist and start collecting nods. This also means that the activity of collecting nodes in networked. The network can grow well beyond its framework in unexpected and unpredictable ways, and this should be expected, anticipated, and planned to the extent possible.
Networks are rhizomes. Or at least rhizomatic. They are unlikely to require or have inherent hierarchical structures; these will have to be applied to the network. Rhizomatic structure and growth suggest unpredictability of nodal connections. As I understand rhizomes, the importance of any node being able to connect to any other node — or to anything, for that matter — cannot be overstated. It is this aspect of rhizomatic connectivity that I would consider “flat.” There are neither more nor less important nodes; there are no inherent political relationships between and among nodes. Any political power attributed to the node will either be self-contained or bestowed from outside the rhizome; within the ecology of the rhizome, all nodes are equally capable of connecting to all other nodes and to anything outside the rhizome. In this sense, I would suggest that rhizomes are politically flat.
Networks can be analyzed in cross-section; they are very difficult to analyze in real time as they exist. They are both too large to examine as a whole and too complex to analyze as active connections are “firing.” Cross-sections can be taken of specific aspects of the network or of the network as a whole. Cross-sections are frozen in time and show little activity, merely traces that can be followed and explored. Networks contains a multiplicity of simultaneous connective activity; our abilities to analyze simultaneity is limited. Instead, we must follow specific threads of connectivity through time and space to analyze them. Such analysis is made possible through cross section.
Google Analytics’ Contributions to English Studies

Google Analytics is rhetorical. Explaining the finer points of Google Analytics to the dog: CC licensed image from Flickr user CyprusPictures.
First, GA can and should be critically examined as a rhetorical technology. GA activity includes reporting. These reports are discursive and rely on visual and written rhetoric to communicate meaning. The “meaning” of a GA report can be manipulated like any other statistical data. Its meanings depend on local environment and conditions, comfort with standard and local meanings of GA terminology (like “session” or “user,” for example), and familiarity with the GA data collection model. Its visualizations can be analyzed for clarity and transparency, for cultural or sociological bias (related to colors used, default views, and other determined factors), and for its connectedness to other discursive elements (like websites whose visitor traffic it measures). Critical rhetorical analysis of GA reports could easily be an object of study by itself.
Second, GA can and should be critically approached as a black-boxed network whose data manipulation and configuration are largely hidden, lacking transparency. Google’s business model depends on its proprietary search results algorithms. It protects that algorithm carefully; while GA reporting is not directly dependent on the search algorithm, website visit data contribute to search results. Full disclosure of its data configuration and processing activities would likely reveal much about Google’s search algorithm; as a result, these processes are only partially disclosed. Google’s own Analytics help files and tutorials explain the order, purpose, and general procedures of data configuration and processing, but these files and tutorials do not reveal in-depth specifics on how collected data are processed into aggregate tables, nor how those tables are then indexed for rapid, near-instant on-the-fly reporting. Google’s market share in web search and advertising result in the formation of what Althusser (1971) called a repressive state apparatus; I suggest that GA is an ideological expression of that apparatus, or an ideological state apparatus. While neither Google nor GA is a state in a political sense, its size and clout suggest an industrial state-like entity with resources and influence strong enough to manipulate or evoke responses from other political entities, as it has done recently in relations with the government of Russia (Khrennikov & Ustinova, 2014).
Third, GA results themselves can and should be critically examined. Far too many otherwise critically-written journal articles use GA results as instrumental rather than mediated. That is, GA report data are accepted as unqualified and accurate reflections of website traffic rather than mediated reports of visitor activity. Little care is given to providing GA-specific definitions of terminology like “session” and “user.” This acceptance can result in significant reporting issues — I’m experiencing a particular situation as I type in which Google has revised a reporting criterion from “visits” to “sessions.” While these two terms are being used synonymously, one implication is that GA has removed the dimension of “unique visit” from its reporting matrix. GA’s definition of session doesn’t differentiate between unique or repeat visits among sessions, as each session is considered a unique event regardless of the identity (which may not be accurately known) of the visitor. Several reports I provide my dean and marketing director were based on unique visit numbers; as a result, I’m forced to rework all of my reports to reflect sessions rather than unique visits. This has implications for perceptions of “progress” and “improvement” among senior leadership, a particularly uncomfortable reality brought to bear this week. (Google changed its reporting structure without fanfare on April 16, announced in a Google+ post.)
Finally, GA’s data collection method can and should be understood as discursive. Individual GIF calls that report data back to Google servers do so in text tags attached to tracking pixels generated through data collection. For example, every GA tag begins with “utm,” a prefix whose meaning is unclear. Many data points are collected in abbreviations whose symbolic meanings would be interesting to explore. Again, GA offers few clues for more obscure abbreviations, although Google does provide a list of many (but not all) dimensions collected via tracking pixel calls. Some of these symbols are explained in the Google Developers (2014) Tracking Code Overview. While parameter abbreviations are obscure, the values themselves are even less clear. Consider the parameter/value pair “utmul=pt-br”: the utmul parameter represents “browser language” while the pt-br value represents “Brazilian Portuguese.” This symbolic communication system is itself fodder for rhetorical analysis and interpretation.
References
Althusser, L. (1971). Ideology and ideological state apparatuses (Notes towards an investigation). In B. Brewster (transl.) & A. Blunden (trans.), Louis Althusser archive. Retrieved from https://www.marxists.org/reference/archive/althusser/1970/ideology.htm (Original work published in Lenin philosophy and other essays)
Castells, M. (2010). The rise of the network society [2nd edition with a new preface]. Chichester, UK: Wiley-Blackwell.
Deleuze, G., & Guattari, F. (1987). A thousand plateaus: Capitalism and schizophrenia. (B. Massumi, Trans.) Minneapolis, MN: University of Minnesota Press. (Original work published 1980)
Google. (n.d.). Algorithms. Inside Search. Retrieved from 1 May 2014 from https://www.google.com/insidesearch/howsearchworks/algorithms.html
Google. (2014). Dimensions and metrics. Google Analytics Help. Retrieved from https://support.google.com/analytics/answer/1033861?hl=en
Google Analytics. (2014, April 16). Understanding user behavior in a multi-device world (Web post). Google+. Retrieved 1 May 2014 from https://plus.google.com/+GoogleAnalytics/posts/LCLgkyCn4Zi
Google Developers. (2014, April 16). Tracking code overview. Google Developers. Retrieved from https://developers.google.com/analytics/resources/concepts/gaConceptsTrackingOverview#gifParameters
Krennikov, I., & Ustinova, A. (2014, May 1). Putin’s next invasion? The Russian web. Bloomberg Businessweek. Retrieved from http://www.businessweek.com/articles/2014-05-01/russia-moves-toward-china-style-internet-censorship
[ Feature image: Today’s latte, Google Analytics. CC licensed image from Flickr user Yuko Honda ]